2023 Price Comparison
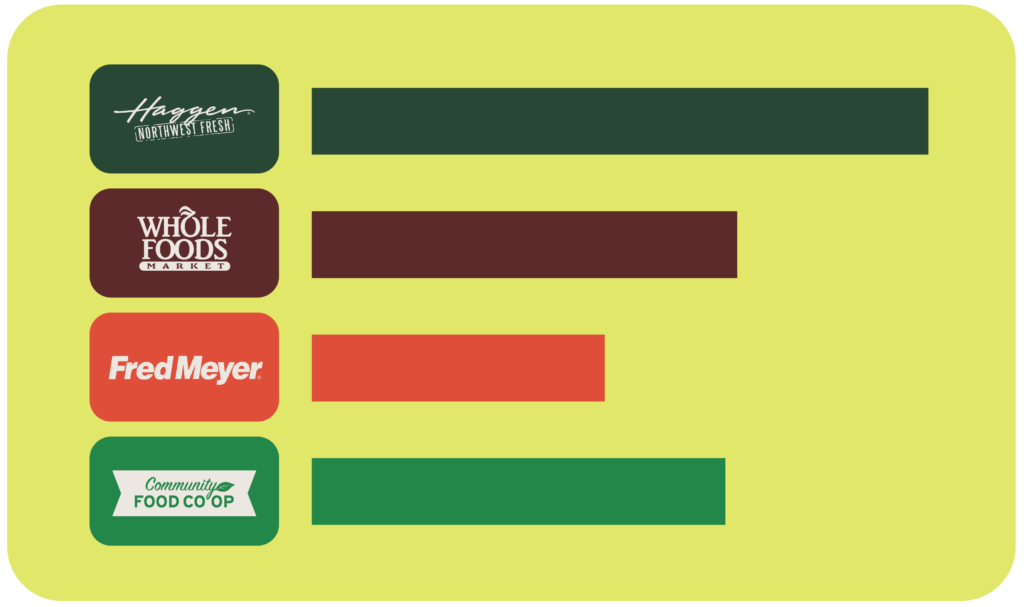
In 2023, the Community Food Co-op compared our top 25 most popular products in each department to that same item at Haggen, Fred Meyer, and Whole Foods. We used Universal Product Codes (UPC) to ensure the items we were comparing were the same. Our private label brand, Field Day was compared to the Haggen, Fred Meyer, and Whole Foods, organic private label brand products. Download the price comparison pdf here.

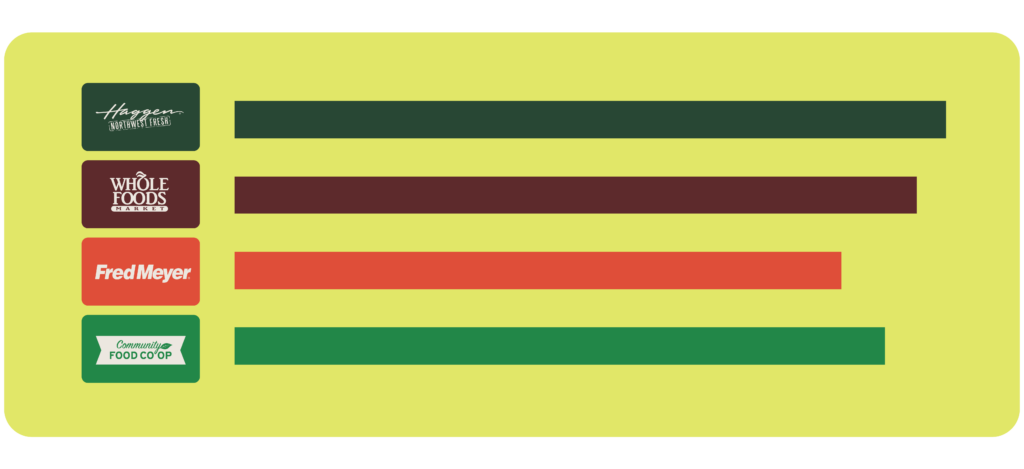
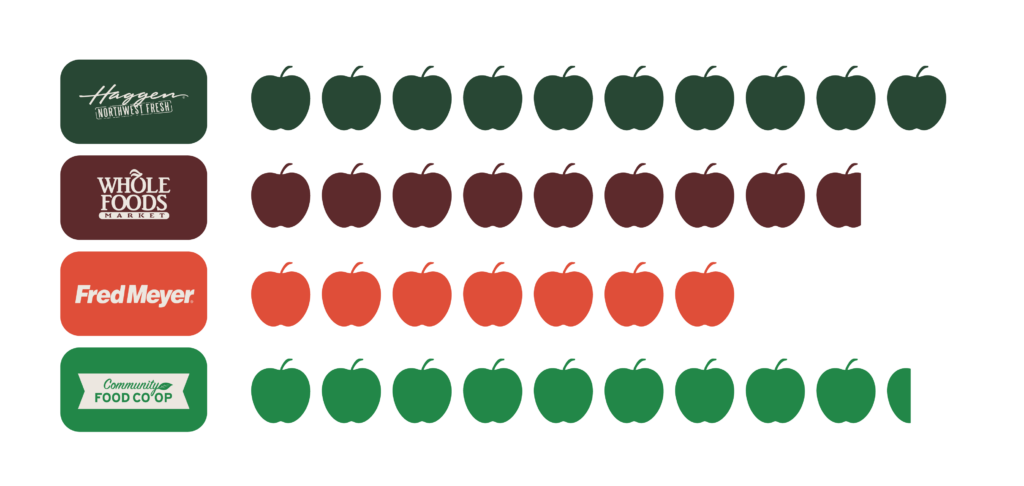
Overall, the Co-op is lower than Whole Foods (5.07%) and Haggen (9.11%) and higher than Fred Meyer by 7%.
Some of the areas where the Co-op is much less than other stores are staples like bread, dairy, and body care.

Bread
11.88% lower than Haggen
2.41% lower than Whole Foods
5.58% lower than Fred Meyer

Dairy
10.9% lower than Haggen
7.69% lower than Whole Foods
9.16% lower than Fred Meyer

Body Care
17.25% lower than Haggen
17.79% lower than Whole Foods
6.70% lower than Fred Meyer
We dug deep into departments and areas where our shoppers buy the most products.
Meat & Seafood Department
We compared organic, natural (hormone-free), and grass-fed items like ground beef and chicken breasts.
10.35% lower than Haggen
6.65% lower than Whole Foods
8.98% higher than Fred Meyer
Produce Department
We compared organic produce only. We were not able to compare local AND organic, which reflects our priority to buy from local farms and farmers whenever possible.
5.67% lower than Haggen
6.09% higher than Whole Foods
23% higher than Fred Meyer
Cheese
12.86% higher than Haggen
Equal (0.00%) to Whole Foods
15.16% higher than Fred Meyer

Cereal
18.21% lower than Haggen
15.34% lower than Whole Foods
11.28% higher than Fred Meyer
Convenience Foods and Entrees
For example macaroni and cheese or heat-and-eat grocery items.

21.58% lower than Haggen
11.28% lower than Whole Foods
17.71% higher than Fred Meyer
Frozen Foods
Private Label
We compared our private label, Field Day, to 365 by Whole Foods, Fred Meyer’s Simply Truth, and the O Organics from Haggen.
30.41% lower than Haggen
2.89% lower than Whole Foods
24.62% higher than Fred Meyer
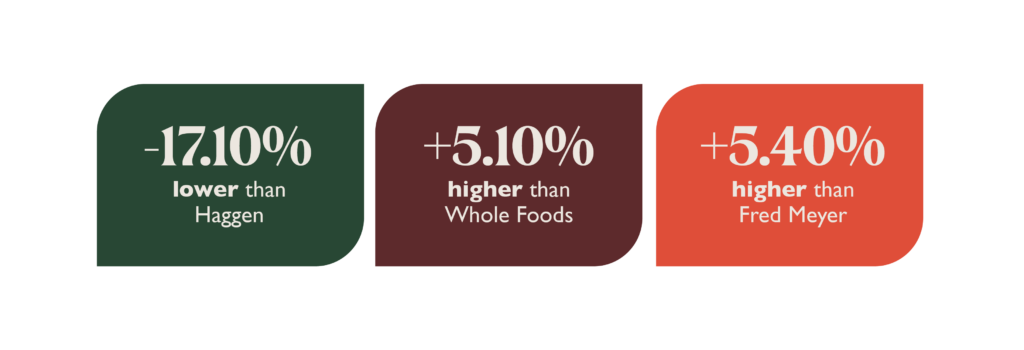
Health & Beauty Supplements
2.54% lower than Haggen
0.12% higher than Whole Foods
5.79% higher than Fred Meyer